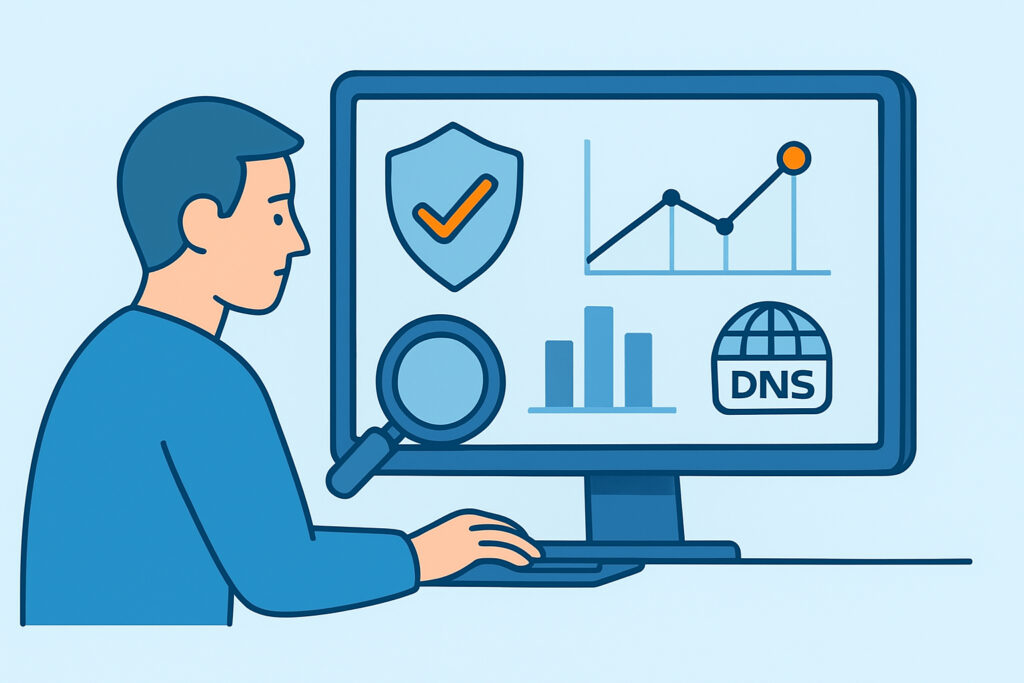
Security teams that want meaningful visibility into their infrastructure need to build dashboards that surface DNS health metrics before issues become incidents. Most organizations already have uptime dashboards, firewall logs, and SIEM integrations – but DNS is consistently underrepresented, even though it underpins nearly every service a business runs.
Why DNS Belongs at the Center of Your Security Dashboard
DNS is the first thing that happens before any connection is made. If a CNAME record drifts, an SPF policy breaks, or a subdomain starts resolving to a cloud service you abandoned six months ago, nothing in a traditional security stack will catch it automatically.
A well-designed security dashboard built around DNS health checks gives teams a single view of record integrity, email authentication posture, and subdomain exposure – all in real time. It shifts DNS from a reactive troubleshooting tool into a proactive security signal.
Core DNS Health Metrics Every Dashboard Should Include
Not every DNS metric is worth tracking in a dashboard. The ones that matter for security fall into a few clear categories.
Record integrity signals – Are your A, CNAME, MX, and NS records resolving to the expected values? Unexpected changes in these are often the first sign of DNS hijacking or a misconfiguration introduced during a deployment.
Email authentication coverage – Track SPF, DKIM, and DMARC configuration status for all your domains. A missing or broken SPF record is a direct path for spoofing attacks. DMARC policy gaps mean you have no enforcement, even if SPF and DKIM are technically in place.
Subdomain health status – How many active subdomains do you have, and are they all pointing to services you still own? Dangling CNAME records and stale DNS entries should be flagged prominently.
SSL/TLS certificate status – Certificates expiring on subdomains that run without active monitoring are a common source of outages and, in some cases, takeover opportunities.
TTL anomalies – Sudden TTL drops on high-value records can indicate pre-attack staging. Attackers sometimes lower TTLs before attempting to redirect traffic.
How to Structure a Useful DNS Security Dashboard
A dashboard that works operationally answers a question at a glance – not one that requires clicking into five sub-menus to find out if something is wrong.
Structure the dashboard in layers:
1. Top-level summary – Overall DNS health score across all monitored domains. Red/amber/green status per domain. Total count of open issues by severity.
2. Email authentication panel – SPF, DKIM, and DMARC status for every domain, with explicit flags for “missing,” “misconfigured,” or “permissive policy.” A DMARC policy of p=none is not protection – it should show as a warning, not a green tick.
3. Subdomain inventory panel – Total discovered subdomains, count of active vs. stale, and any flagged as pointing to unclaimed services. This is where subdomain takeover risk lives.
4. Record change feed – A timestamped log of all DNS record changes, sortable by record type and domain. Changes that weren’t authorized are the ones worth investigating immediately.
5. Alert history – Which issues have fired, when, and whether they were resolved or suppressed. This matters for audit trails and compliance reporting.
The Myth That One Dashboard Fits Every Team
A common misconception is that a single DNS monitoring dashboard will serve both the operations team and the security team equally well. In practice, these audiences need different views of the same data.
An operations team wants to know: is anything broken right now? They care about propagation failures, TTL mismatches, and resolution errors that affect uptime. A security team wants to know: has anything changed that wasn’t authorized? They care about subdomain exposure, SPF gaps, and whether a DNS record is now pointing somewhere unexpected.
The underlying data is the same. The views should be different. Build role-specific dashboard layouts that surface what each team actually acts on, rather than a single view that tries to do everything and ends up serving nobody well.
Translating DNS Alerts into Dashboard States
Raw alerts are noise unless they map to clear dashboard states. A practical approach is to classify DNS health issues by impact:
Critical – Any record pointing to an unclaimed service (immediate subdomain takeover risk), DMARC missing entirely, NS records changed without authorization.
High – DMARC in p=none mode with no enforcement plan, SPF records with +all (which negates SPF protection entirely), certificates within 14 days of expiry on monitored subdomains.
Medium – Stale subdomains with no recent traffic, broken DKIM selectors, TTL values inconsistent with stated change policy.
Low – Minor propagation delays, deprecated record types still in use, informational logging gaps.
Map these classifications to visual indicators in the dashboard and set alert thresholds accordingly. A critical issue should never sit unacknowledged for more than a few minutes. Effective DNS monitoring practice means defining what “acknowledged” actually requires – not just closing the alert, but confirming the root cause.
Integrating DNS Health Data with Broader Security Tooling
DNS health metrics have more value when they feed into the broader security workflow. A subdomain that suddenly points to an unclaimed AWS S3 bucket is not just a DNS problem – it’s a potential phishing surface that should trigger your incident response process.
Consider piping DNS alert data into your SIEM alongside endpoint and network events. A record change that coincides with a failed login attempt or unusual outbound connections from the same IP range is a very different signal from an isolated record change. Context is what separates noise from a genuine threat.
Real-time DNS surveillance gives you the raw material – integrating it into a broader security operations workflow is what makes it actionable.
Frequently Asked Questions
What is a DNS health metric?
A DNS health metric is a measurable indicator of whether your DNS records are configured correctly, resolving as expected, and free from security issues like stale entries or missing authentication records. Common examples include SPF/DKIM/DMARC status, CNAME resolution accuracy, and subdomain inventory completeness.
How often should DNS health metrics refresh on a security dashboard?
For security purposes, near real-time or polling intervals of 5–15 minutes are appropriate for high-value records. Lower-risk records can be checked hourly. The key is that changes to critical records – NS, MX, CNAME entries pointing to third-party services – should trigger immediate alerts rather than waiting for the next scheduled check.
Do DNS health dashboards require access to the DNS zone file?
Not necessarily. External DNS monitoring works by querying public resolvers and comparing results against known-good states. You don’t need direct access to the zone file to detect most security-relevant changes, though zone access helps confirm what was intended versus what is actually resolving.
Summary
Building a security dashboard around DNS health metrics is less about finding the right visualization tool and more about deciding what questions the dashboard needs to answer. Start with the metrics that directly map to attack vectors: subdomain takeover risk, email authentication gaps, and unauthorized record changes. Layer in change history and alert states, and build separate views for operations versus security teams.
DNS health is not a set-and-forget configuration task. It’s an ongoing signal that deserves permanent, visible representation in your security operations workflow.